How Many Bets Do You Need To Know If You Have An Edge?
10th May 2026
In a previous article I introduced the idea that profitable gambling comes from finding positive expected value. If our true win probability is higher than the probability implied by the odds, then over a large number of bets we should make money.
The uncomfortable part is that "over a large number" can mean thousands, tens of thousands, or more. A strategy can be profitable and still lose money for a long time. A strategy can also be unprofitable and look brilliant for a while.
So the useful question is not just:
Do I have an edge?
It is:
How many bets do I need before the result means anything?
Defining Edge
Assume we bet one unit each time at decimal odds .
If the bet wins, our profit is:
If the bet loses, our profit is:
If our true probability of winning is , then the expected profit per unit staked is:
This simplifies nicely:
This is our edge, or expected return on stake. If , then we expect to make five cents for every dollar staked. If , then we expect to lose five cents for every dollar staked.
Fair odds imply:
Positive edge requires:
For example, at odds of , the implied probability is . If our true win probability is , then:
That is a edge.
The Law Of Large Numbers
The law of large numbers says that as we repeat a random experiment many times, the average result converges toward its expected value.
For betting, that means:
Where:
- is our average profit per bet after bets.
- is our true expected profit per bet.
This is the reason an edge eventually shows itself. But the law of large numbers does not say it shows itself quickly.
The speed depends on variance.
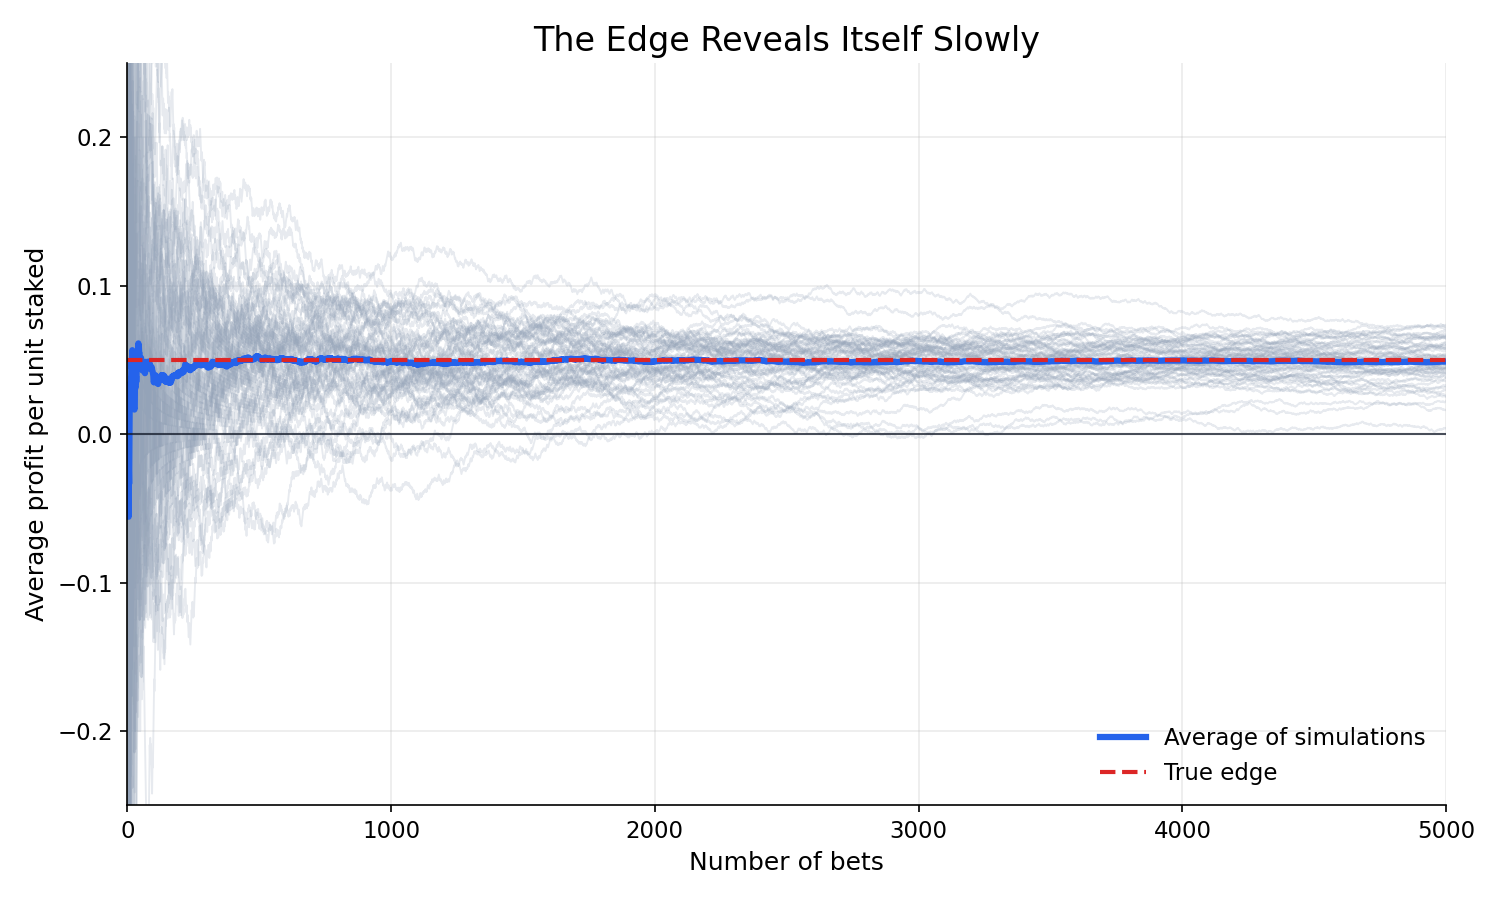
The chart above simulates strategies with the same true edge at odds of . Some paths look excellent early, some look terrible, and all of them are noisy. The average path moves toward the true edge, but individual paths can wander for thousands of bets.
Why Odds Matter So Much
A bet at wins often and loses less violently. A bet at loses most of the time, then occasionally wins a large amount.
Even if both have the same edge, the strategy needs far more bets before the edge becomes obvious.
For one unit stakes, profit can be written as:
Where is if the bet wins and if it loses.
The variance of one bet is:
So the standard error of our average profit after bets is:
This is the key formula. More bets reduce uncertainty by the square root of , not linearly. To cut your uncertainty in half, you need four times as many bets.
Calculating Required Sample Size
Suppose we want to know whether our observed edge is statistically significant. A simple approximation is:
Where:
- is the required number of bets.
- is the confidence threshold.
- is the standard deviation of one bet.
- is the edge we are trying to detect.
For a rough two-sided confidence interval, use:
This means we are asking for the edge to be large enough relative to the noise that zero is outside the confidence interval.
Sample Sizes By Odds Range
The table below estimates how many flat-staked bets are needed to detect a positive edge with about confidence.
The assumed true win probability is:
So each row compares different odds at the same expected return on stake.
| Decimal odds | Bets for 2% edge | Bets for 5% edge |
|---|---|---|
This is why longshot strategies are so hard to evaluate. You can have a real edge at high odds and still need a huge sample before the profit and loss curve becomes convincing.
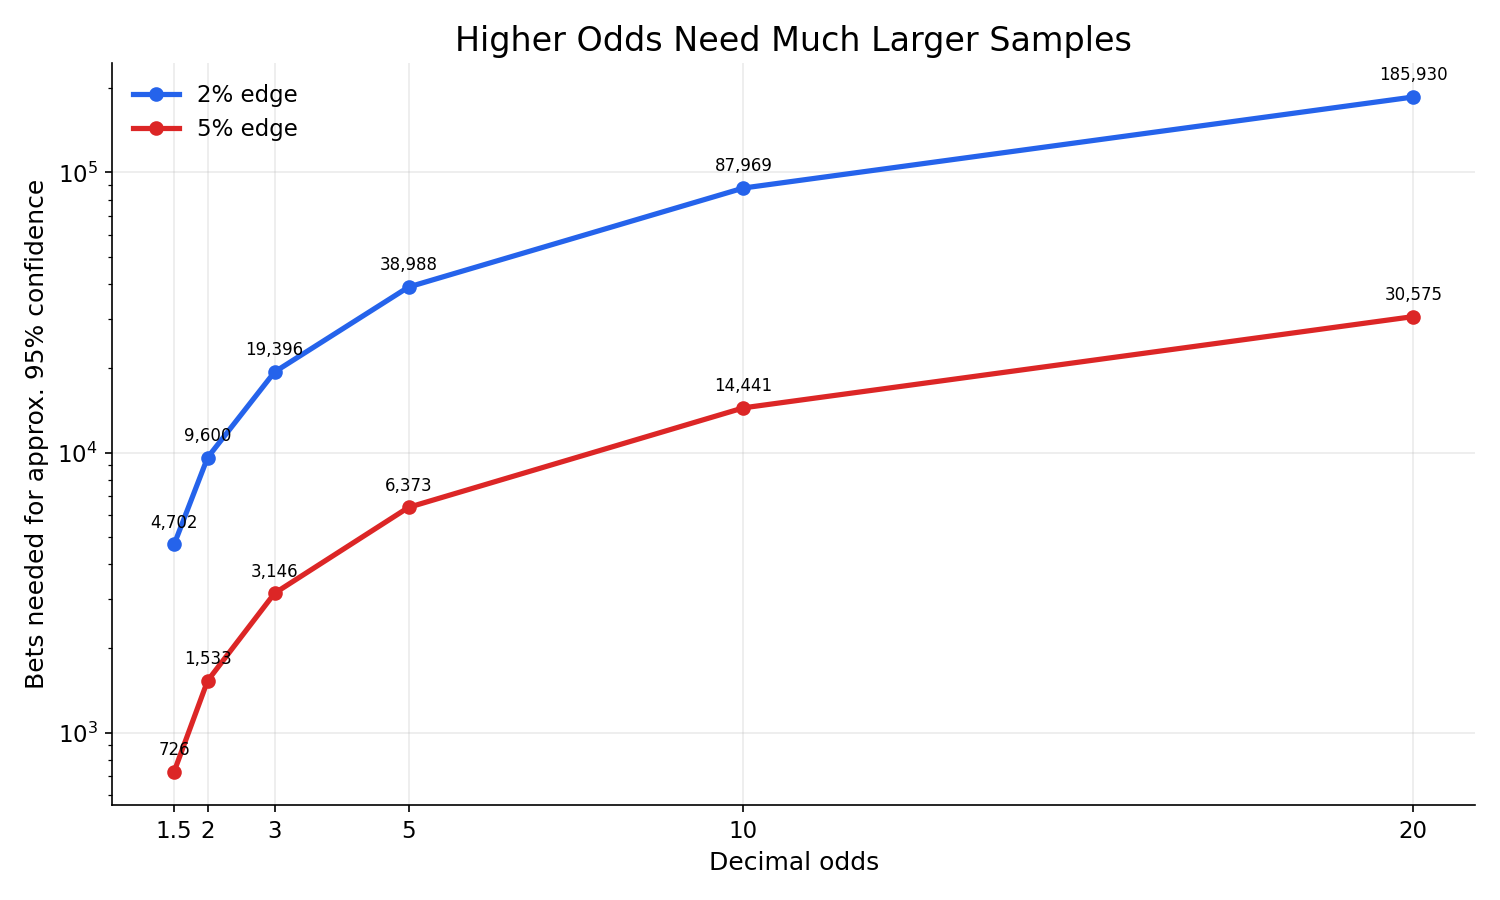
The relationship is not gentle. Moving from odds of to odds of can multiply the required sample size many times over, even when the expected return on stake is unchanged.
A Worked Example
Imagine we place bets at odds of and make a return on stake.
Our observed average profit per bet is:
At odds of , the standard deviation of one bet is close to:
So the standard error is:
A confidence interval is approximately:
So the interval is roughly:
That is right on the boundary. The result is encouraging, but not yet overwhelming. If the same edge held for bets, the standard error would shrink:
The confidence interval would be:
Now the lower bound is clearly positive.
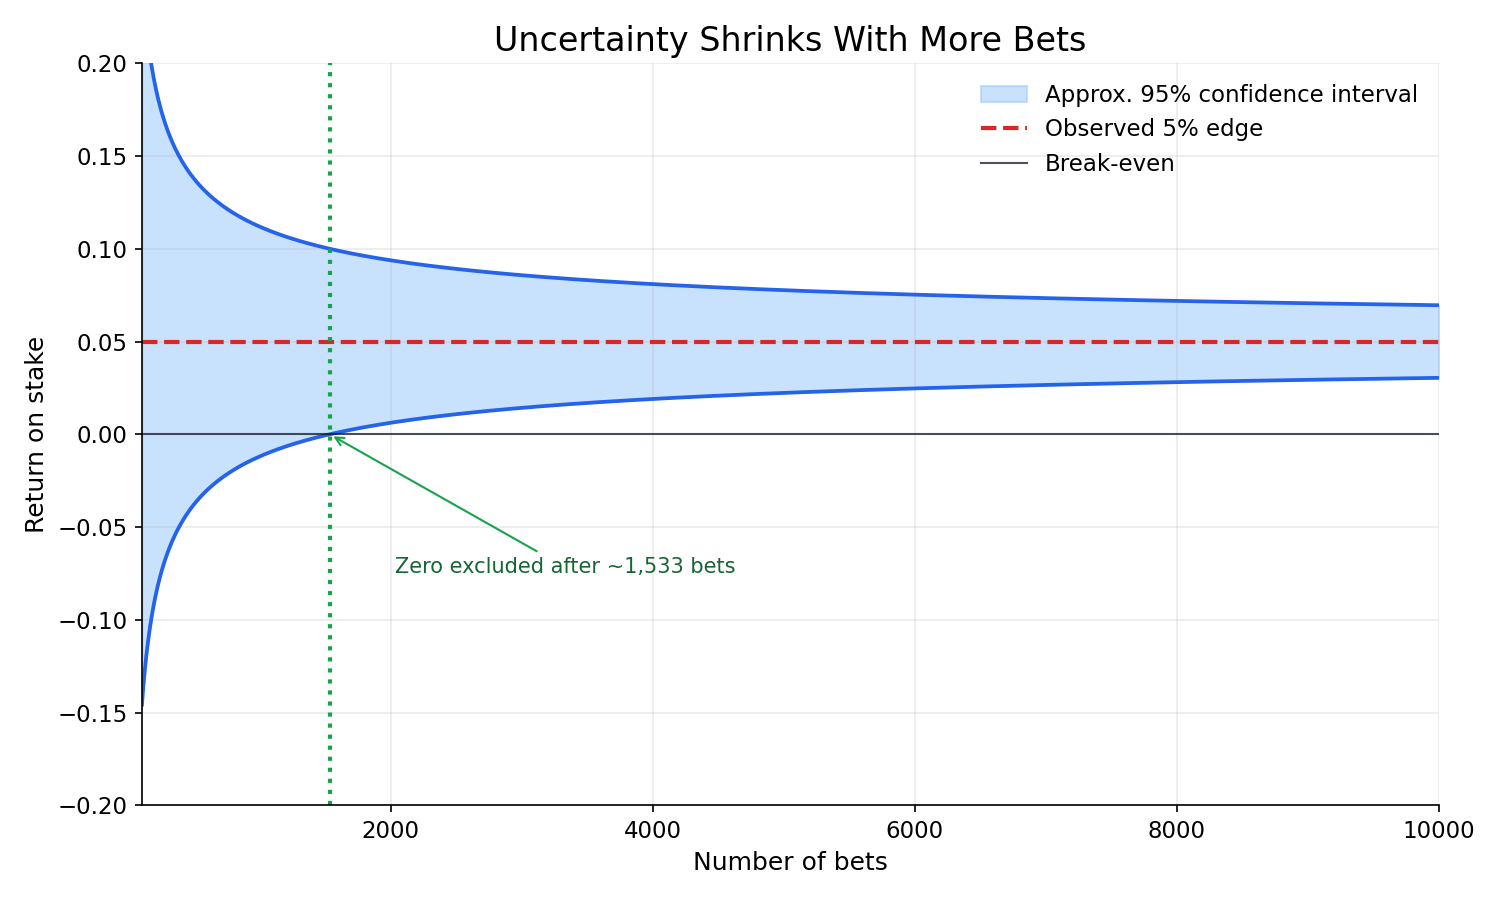
The confidence interval narrows because the standard error falls with . Early results can be directionally useful, but they are wide enough that zero edge remains plausible. As the sample grows, the same observed return becomes much harder to dismiss as noise.
Estimating The Edge You Actually Have
In practice, we do not know the true edge. We estimate it from results:
Then we estimate uncertainty:
And build a confidence interval:
If the lower bound is above zero, the results are statistically consistent with a positive edge. If the interval includes zero, you may still have an edge, but the sample is not large enough to say so confidently.
Common Mistakes
The first mistake is treating profit as proof. Profit after bets tells us almost nothing, especially at higher odds.
The second mistake is pooling completely different bet types without thinking. A favourite and a longshot have very different variance profiles. If you combine them, you should still calculate variance correctly.
The third mistake is changing the strategy halfway through the sample. If your model, market, staking, or execution changes materially, the old results may not describe the new strategy.
The fourth mistake is ignoring closing line value. Profit and loss tells us what happened. Price movement can give a faster signal about whether we are consistently beating the market, although it is still not a perfect substitute for expected value.
The Practical Takeaway
There is no universal number of bets that proves you have an edge.
At short odds, a few thousand bets might be enough to detect a modest edge. At long odds, even tens of thousands of bets may be noisy. The smaller the edge, the larger the required sample. The higher the odds, the larger the required sample.
The law of large numbers guarantees convergence eventually, but variance determines how painful "eventually" is.
That is why profitable betting is not just about finding an edge. It is also about surviving long enough, tracking results cleanly enough, and sizing bets conservatively enough for the edge to reveal itself.